
")

Indicator Name: ClusterDelta_#Footprint
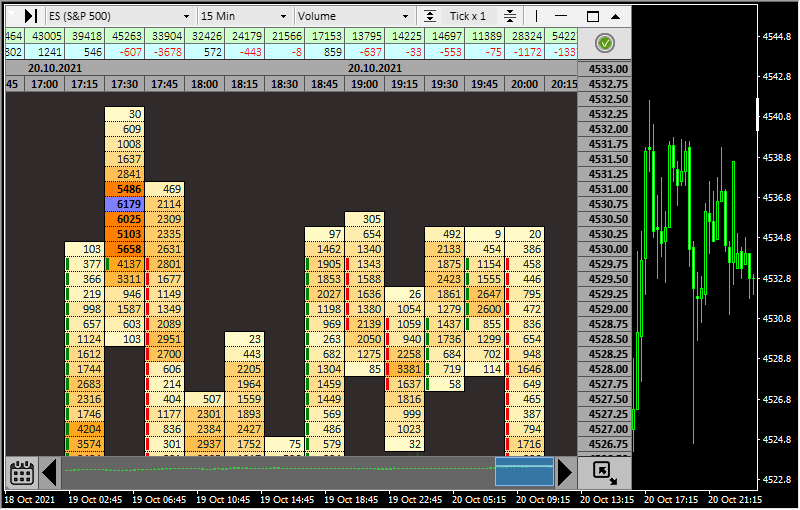
Footprint is a type of the chart where you can see sum of the traded volumes at a specified price for a certaing period. Commonly the Footprint term is used with the term Order Flow.
The #Footprint indicator allows us to see accumulation and distribution of market volumes. This gives us to conduct accurate analysis based on how the markets were traded.
The main functionality includes:
- 25+ wide known market derivatives (exchanges, energy, metals, indexes etc)
- Timeframes Charts from M1 to Weekly
- Custom Range-bar charts
- Built-in Market profiles
- Order flow charts mode: Volume, Delta, Ask x Bid, Volumes x Delta, Bid x Ask and others
The main advantages are
- Graphic user-friendly interface
- Scaling charts for high-volatility markets
- Custom chart settings for current purposes
The Green and Red rectangles on the left side of the candle shows the body of the candle and Open/Close prices. Green means that the candle is bullish, the Open price is lower, the Close price is higher. Red means that candle is bearish, the Open price is higher and the Close price is lower.
The indicator automatically loads new data when it reaches its bounds of the loaded data. You can use built-in calendar to select a start date. There are data from Jan, 1, 2020 (for some instruments from Feb, 1). Huge amount of data will freeze your terminal. Do not load too much data during one session.
The automatic data update can be turned off by pressing CTRL+BREAK. It turns on again if you remove/add indicator or change the chart timeframe.
If there is more than one ClusterDelta indicator with a graphical panel to avoid mishandling, mouse events are handled by only one indicator. To activate another indicator, just double-click on its the graphical panel.
You can use more than one #footprint on a chart, but try not to intersect their work area because the data will overlap.
If you lose the indicator control window - press F5, it will return to its default position.
The indicator description is divided into two parts. Interface description and Inputs descriptions.
INTERFACE DESCIRPTION
There is an interactive menu at the top that allows you to change some parameters that will affect the content.
In the upper left corner you can see a sign like ">|", by clicking on the chart will move to the last loaded bar (you can set shift by changing the input "Shift from right edge (in bars)..."). The same if you press END on the keyboard.
Next, you can see dropdown list of available instruments. You can define it in the input "Futures Name..." or leave AUTO for automatic detection.

The following list is the method for displaying data. The first element is"Same as MT" means the display order flow chart on the same timeframe as in Metatrader for the current chart. Th timeframe can be selected from the list; it ranges from 1 minute to 1 week.
Changing the timeframe will keep all objects on the order flow chart such as vertical and horizontal levels.A method for displaying data in the form of range bars has also been added, where each candle contains a predetermined height (in the number of ticks). There are 5 predefined values in the list, but you can change it in the "Range of predefined values ..." inputs. It is not recommended to use very low range values such as 1-4 because the range chart is always loaded from the beginning of the day, so this will create a lot of objects, causing the terminal to freeze.
Following list shows the data display types. There are:
- Volume - a chart displaying volume data
- Delta - a chart showing delta data
- Ask x Bid - a chart where the ask and bid are displayed using "Volume" data color scheme
- Volume x Delta - a chart that displays volumes delta as columns in the cell with different color schemes
- Bid x Ask - for compatibility with views from others applications. the Bid x Ask type with its own color scheme has been included
- No Data - simple chart view without numerical data
There are profile types for displaying data: Volume Profile, Delta Profile, Bid x Ask profile (a profile in which the bid data is directed to the left and the ask data is to the right)
For a better understanding of high volatility markets there is a "tick multiplier" option. It is located right to the chart types. Just compare to the charts below for the same instrument/timeframe/time but with different Tick x 1 and Tick x 20 multipliers for FDAX:


All volumes included in one step are summarized. You can find the size of the price step in the price panel. You can use "/" and "*" on the right keypad to change the tick multiplier. Predefined values can be set an the "Predefined Tick Multiplier" input.
The next block contains the elements "| - X", where the vertical line allows to set the vertical level on the order flow chart, the horizontal line - horizontal levels, and "Х" in active mode destroy the selected object. Horizontal levels also can be placed with Shift key pressed. When you click on an existing level, it changes colors (there are three color schemes), and then removes the level from the chart. Choosing a level while holding down the CTRL key removes it from the chart.
The following elements are used to resize/scale the chart.

The first block is responsible for the width of the cell (can also be changed with the [+] and [-] keys), the second block is responsible for the height of the cell, the third block is responsible for the font size of the chart, and 4th one allows you to change different fonts. If you press "Enter" on the right keypad, you can switch between predefined templates, including template by default.
The last button with the Clusterdelta logo open a window with a quick help. You can use Enter on the main pad to open it.
The last icons (rectangle and triangle) are used as the Expand/Collapse indicator window.
Please note that the F11 button opens the current MetaTrader chart in full screen mode.
To move the indicator, you can drag it by clicking on menu or area where there is a volume/delta summary per candle. Below this area is the time panel. Clicking on the time adjusts the chart to the Close price of the corresponding candle. The time panel shows the Open time of the candle.
Below Expand/Collapse icons, there is built-in authorizer. You must enter your clusterdelta login and password in the form to enable automatic authorization. A green authorization icon means that authorisation was successful. An orange icon means the subscription will expire in less than 3 days. A red icon indicates that the subscription was not found (or the user is not authorized). The blue icon asks that the current authorization status is not loaded yet
The Price panel has an additional function. It allows you to resize the indicator window horizontaly by dragging. The icon in the lower right corner allows you to resize it in any directions.
There is a Calendar icon in the lower left corner. Selecting a new date will reload order flow chart from the selected date.
At the bottom there is the navigation panel - it shows the loaded part of the chart for quick navigation. The visual part of the loaded chart is displayed in the blue window. and the active are of the chart is displayed in the light box. The window can be moved horizontally and the lighting box vertically for quick navigation. The navigation panel can be adjusted in height by dragging it off the bottom edge. To navigate you can use use the keyboard: up/down/left/right arrows and PgUp, PgDn buttons, which repeat the functionaly of the right and left arrow icons on the navigation panel.
Navigation with arrows does not move the chart to the visual area. Navigation with PgUp/PgDn adjusts the chart to the price of the middle bar of the active area.
Description of keyboard control:
- F5 - resize the indicator window to the default position depending on the size of the main window chart
- HOME - move the chart to the first loaded candle
- END - move the chart to the last loaded candle
- PAGE UP - move the chart back screen back
- PAGE DN - move the chart forward one screen
- ARROW LEFT - move the chart back two candles
- ARROW RIGHT - move the chart two candles forward
- ARROW UP - move up 4 price step
- ARROW DOWN - move down 4 price step
- TAB - move forward for a certain period depending on the current timeframe (4 hours, 8 hours, 1 day)
- SPACE - adjust the chart position to the close price of the middle bar
- SHIFT/CTRL - manage objects on the chart
- Keys on the right keypad
- [-] - decrease the width of candle
- [+] - increase the width of candle
- [/] - decrease the tick multiplier
- [*] - increase the tick multiplier
- Enter - switch between predefined templates
- F11 - switch to fullscreen mode (native MT functionality)
INPUTS DESCRIPTION
INPUTS can be categorized by colors and some control functions.
Futures Name... - select a futures from the dropdown list for the order flow chart. Value AUTO causes automatic detection of the instrument by the MT ticker.
GMT of MetaTrader - the GMT value of your Metatrader. In 95% of cases leave AUTO.
Inactivity timeout in seconds for auto adjusting workspace - timeout value for mouse movement/keyboard actions when the indicator tries to automatically adjust the chart to the last known bar if it is in the visible area.
Major Values Level (0-100) - value in percents (default is 68) for determining the valueable volumes (less than Top). If the volume is greater than this percentage of maximal volume and less than Top level, the color scheme "above major" will be used.
Minor Values Level (0-100) - value in percents (default is 0) for determining the common volumes (should be less than Major). If the volume is greater than this percentage of maximal volume and less than the Major level, the color scheme "minor<->major" will be used. All volumes below than Minor level are displayed using default color scheme.
Percent of Total Candles for Top Value Calculation - how many candles with the maximum volumes of the total value of the candles will be used to determine the Top level as the average of these candles. Very high spikes of volumes should be avoided as they can affect the overall appearance of the order flow chart.
Indicator settings at startup:
Predefined Chart Type - select a chart type from the list (Volume/Delta/Ask x Bid etc...)
Predefined Chart View (Time/Range) - select a mode from this list - timeframe or range
Number of ticks per Range bar - if you selected a range-bar mode, you must specify the number of points (size) per candle (Range Chart).
Predefined Tick Multiplier - set Tick Multiplier value for the price .
Width of Cluster Cell - the width of the candle cell from 7 to 60. The default value is 20. If you wish to use the "profiles mode" it is recommended to increase this value.
Height of Cluster Cell - cell height from 1 to 15. The default is 7.
Size of Font - font size from 5 to 19, or 0 so that the text is not displated.
Type of Font - there are 4 different fonts for custom settings.
All of the above eight settings can be changed during work with indicator
Maximized Mode on Start or Normal - an option that allows to expand the footprint window to the maximum size at startup
Minimum TopValue on Start - the minimum Top level for color schemes.
Maximum TopValue on Start - the maximum Top level for color schemes. It is strongly recommended not to change it.
Shift from right edge (in bars)... - for convient online viewing of data, you can set the number of bars from the right edge of the chart, which is shifted when the last candle reaches the price panel.
There 5 predefined values for range charts in the interactive menu. You can set it in the inputs below.
Range predefined values for dropdownlist, 1st value - default value for the first element in the list
..., 2nd value, ..., 3rd value, ..., 4th value, ..., 5th value - 2nd, 3rd, 4th and 5th elements of the list.
Color Schemes
Default Cluster Background - cell background, where the volume is less than Minor level
Default Cluster Color - font color for volumes less than Minor level
Color scheme for Volume mode (gradation is 0 - minor - major - top+ )
Cluster BG minimum for minor<->major, Cluster BG maximum for minor<->major - these values are used to determine the background depending on the volume size in accordance with the Major and Minor levels.
Cluster BG for values above major level - cell background for volumes exceeding the major level.
Cluster BG for values above top level - cell background for volumes above the top level
Font Color for minor<->major Value - font color for volumes in the minor<->major range
Font Color for Values between major<->top - font color for volumes in range major<->top
Font Color for Values above top level - font color for volumes above the top level
Font Bold for minor<->major value - parameter to use bold font for volumes in the minor<->major range
Font Bold for major<->top values - parameter to use bold font for volumes in the major<->top range
Font Bold for top+ values - parameter to use bold font for volumes in the range above the top values
Color scheme for Delta mode (gradations is min - 0 for negative values and 0 - max for positives)
Cluster min BG for Delta Positive Values - background color for minimal (absolute) positive delta values
Cluster min BG for Delta Negative Values - background color for minimal (absolute) negative delta values
Cluster max BG for Delta Positive Values - background color for maximal (absolute) positive delta values for building a gradient
Cluster max BG for Delta Negative Values - background color for maximal (absolute) negative delta values for building a gradient
Font Color for Delta Positive Values - font color for normal delta+ values
Font Color for Delta Negative Values - font color for normal delta- values
Font Color for Max Delta Positive Values - font color for maximum (absolute) delta positive values
Font Color for Max Delta Negative Values - font color for maximum (regarldess minus sign) delta negative values
Font Bold settings for max positive values - option to use bold font for maximal positive delta values
Font Bold settings for max negative values - option to use bold font for maximal (absolute) negative delta values
Color scheme for the summary panel per candle Volume/Delta
Volume Panel Background - background for volume values
Delta Panel Background - background for delta values
Volume Color - font color for volume values
Delta Positive Color - font color for positive delta values
Delta Negative Color - font color for negative delta values
Separator Color - color of separator lines
Color scheme for time panel
Time Panel Background - background color
Time Panel Font Color - font color
Time Panel Line Color - color of separating lines
Color scheme for price panel
Price Panel Background - background color for all prices
Price Panel Font Color - font color for all prices
Price Panel Current Price Background - background color for the current price
Price Panel Current Price Font Color - font color for the current price
Price Panel Lines Color - color of separating lines
Color scheme of Navigational Panel
Navigation Panel Background - Background color
Navigation Panel Active Window Background - background color of the active window of the navigational panel
Navigation Panel Window Active Area Color - background color of the active area in the active window
Navigation Panel Window Active Line Color - border color of the active area
Navigation Panel Chart Color - chart color in the navigational panel
Color scheme for Volume Profile mode
Sign to mark Open/Close bars - option to show Open/Close marks inside a candle (depending on the mode it would be always on or hide all)
VolumeProfile Color Set - choose the mode of the volume profile color scheme: custom or color scheme of Volume mode. Custom is defined by the colors below
Minor Value color of Volume Profile - color of the histogram for values defined as minor to build a gradient depends on the current value
Minor Value color of Volume Profile - color of the histogram for values defined as mijor to build a gradient depends on the current value
POC of Volume Profile - color of histogram for values above Top level
Errors description:

This error signal that your MetaTrader does not allow "DLL import" from indicators. To resolve the issue, press CTRL+O (or go to the Options menu), selecte Experts Advisers tab, and select the "Allow DLL Imports" option. You can also do this every time you add an indicator to the chart by selecting this option in the Common tab of the indicator.

This window shows that indicator can not find required DLL files. You must copy all files from the archive you downloaded. Open Metatrader, Menu "File" -> "Open Folder Data". In a new window go into the MQL4 folder and copy everything from the archive here. Then you need to remove and add indicator again. And just inform you that you can remove this window from the list of objects (CTRL+B)

This error indicates that you do not have access to the indicator data on the server. This is usually because you are not authorized or you do not have Premium subscription. Use the built-in authorizer in the Clusterdelta manager (upper right corner), enter your credentials (clusterdelta login and password) and refresh the current status.

