
")

Indicator name: ClusterDelta_#Splash
The Splash indicator is the first indicator in the ClusterDelta series that deeply analyzes tick history. This indicator is designed to search for large spikes in volume, when a large amount of the volume has passed in a short period of time.
The nature of the exchanges allow buyers and sellers to act together, and even the presence of a large player on the tick chart will not be obvious, since any large order in the process of execution will be split into many small orders, depending on the number of participants. But there are situations when sellers and buyers with large volumes meet together. Then big volumes slip in the tape - for example, 60 or 100 lots in one tick. Usually we call this the presence of smart money, counting on that they control the market, and we should monitor their actions. The indicator is designed to collect the fragmented trades of large players into one order that is called Market Splash.

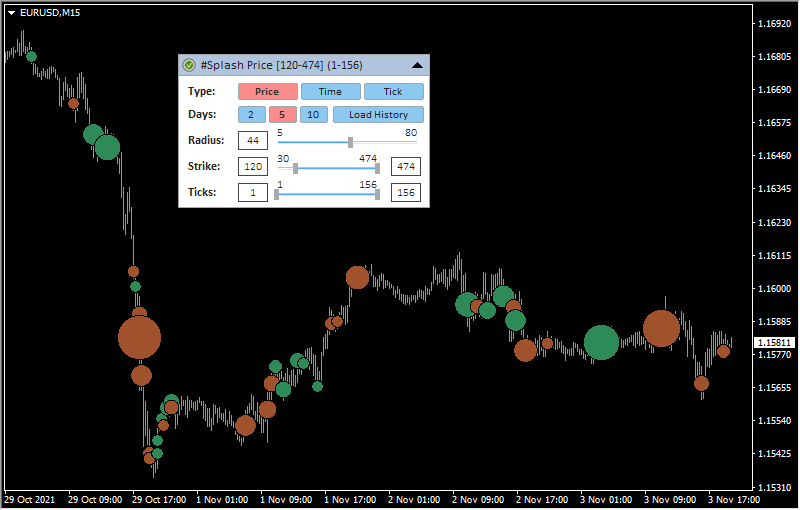
Description of graphic panel:
-
1 - authorization status (for more details on authorization, see the How to install and use indicators section)
- Price - indicator aggregates ticks one by one using price, type (buy/sell) and time.
- Time - indicator aggregates ticks using only type and time. (useful on the high volatility markets)
- Tick - indicator do not aggregate data and uses it as is
2 - the name of the indicator and the instrument - the data source. Using Drag & Drop, you can move the panel along the chart (to activate the panel, you may need to double-click the mouse)
3 - the icon to Expand/Collapse graphic panel
4 (Type) - - indicator building mode corresponding to the TickAggregate_Mode input parameter.
6 (Radius) - the value defines the size of the objects for scaling data amonh themselves on the chart depends on the maximum volume.
7 (Strike) - the range of volume values that is used to plot on the chart. The minimum value is defined by the The Lowest Strike Value parameter; to optimize the load, the minimum accumulation value is set at 20 lots. The maximum is defined on the actual data. In the graphical panel, the current values can be changed with the slider or by editing the value in the text fields.
8 (Ticks) - minimum number of ticks that is participated in aggregation
Radius can be preset by the input Object_MaxRadius. Strike can be preset by the inputs MinStrike/MaxStrike. Ticks can be preset by the inputs AggregateTicks_Minimum / Aggregate_TicksMaximum
You can hide the panel completely from the screen with the "Z" button - pressing it again will return the panel display.
The F5 button allows you to reinitialize the coordinates of the panel based on the current size of the chart window (it helps if the panel has disappeared from the workspace). Please note that resetting coordinates will not display the panel that is already hidden by the Z button or by the input "GUI" parameter.
When adding an indicator to a chart, priority is given to the input parameters. However, after making changes to the settings through the graphic panel, the indicator takes the current parameters from the graphic panel when the timeframe changes. In some cases, removing and re-attaching an indicator will help to solve a specific problem.

Description of indicator inputs:
- HELP_URL (value is "https://clusterdelta.com/splash") - this is the URL where you can get the full description of the indicator.
- ChartInstrument - select a futures from the dropdown list as the source for data. Value AUTO causes automatic detection of the instrument by the MT ticker.
- Futures_Expiration - expert setting in which you can specify the expiration of the futures as mm-yy or mmyy if you need to obtain data from another contract (maybe a previous one). mm = month, yy - last two digits of the year
- MetaTrader_GMT - the GMT value of your Metatrader. In 95% of cases leave AUTO.
- TickAggregate_Mode (default value is "Aggregate_Tick") - defines the data analysis method for aggregating the data.
Possible values TickAggregate_Mode:
- Tick_By_Tick - indicator do not aggregate data and uses it as is
- Aggregate_Tick - indicator aggregates ticks one by one using price, type (buy/sell) and time.
- Aggregate_Time - indicator aggregates ticks one by one using only type (buy/sell) and time.
- MinStrike (default value is "100") - minimum splash size to display on the chart
- MaxStrike (default value is "0") - maximum splash size to display on the chart. A value of "0" means no limits.
- AggregateTicks_Minimum (default value is "0") - minimum number of the ticks participating in the aggregation of the splash.
- AggregateTicks_Maximum (default value is "0") - maximum number of the ticks participating in the aggregation of the splash.
- LowLevelStrike (default value is "30") - the minimum value of the size of the splashes to download from the server to optimize the load when working with the graphical panel
- History_in_Days (default value is "5") - the number of days to plotting data.
- Other_Settings (default value is "--- Period for calculations ") - just a text comment
- Online_Mode (default value is "until_NOW") - defines how to load data
- until_NOW - load data until the current moment
- until_CustomLastDate - load data until time defined in Custom_LastDate
- Custom_LastDate (default value is "2021.01.01 00:00") - defines the end datetime to load data if the Online_Mode parameter is set to "until_CustomLastDate".
- Ask_Tick_Color (default value is "SeaGreen") - sets the color for displaying splashes aggregated on ticks at the Ask price
- Bid_Tick_Color (default value is "Sienna") - sets the color for displaying splashes aggregated on ticks at the Bid price
- Object_MaxRadius (default value is "36") - maximum circle radius. Used to scale different values.
- ObjectMaxVolume (default value is "AUTO") - maximum volume corresponding to the maximum radius for the objects to draw. Used for scaling different sizes of the splash values. If this is a predefined value (and not AUTO)m splash objects larger than ObjectMaxVolume will be surrounded by a golden border, but the radius of the object will not exceed the ObjectMaxRadius value
- Forex_Shift_mode (default value is "Auto") - defines a method for calculating the difference in the prices between futures and forex.
Possible values of the Forex_Shift_mode:
- Auto - the offset will be calculated based on the "High" and "Low" prices of the forex and futures bar.
- Manual - the offset will be set manually via the Forex_Shift variable
- ForexShift (default value is "0") -the number of points by which the indicator data will move up or down if the Forex_Shift_mode parameter is set to "Manual". This variable can be either greater than or less than zero. It is intended to take into account the forward points (the difference between the prices of the futures and the forex/spot).
- ReverseChart (default value is "false") - for reverse currency pairs with names that differ from "USD/JPY", "USD/CAD", "USD/CHF", the value must be "true" to flip indicator data according to the direction of the price chart
- DO_NOT_SET_ReverseChart (for"...for USD/JPY, USD/CAD, USD/CHF --") - the comment in the inputs about the information describe above
- Comment_On_TimeFrame (value is "(0-All, 1-M1, 2-M5, 4-M15, 8-M30, ") - a comment describing Only_On_TimeFrame parameter possible values
- Comment_On_TimeFrame_ (value is "16-H1, 32-H4, 64-D1) - can be mixed")
- Only_On_TimeFrame (default value is "0") - used to display data on specific timeframes. Since objects are plotted directly on the chart, the native "display" tab and the data in it are ignored. To apply a data to specific timeframes it is necessary to add the numbers of these timeframes (the numbers are indicated in the comment above). For all timeframes, leave "0", to display only on the M5 timeframe, put "2", and, for example, for only M30 and H1 timeframes, add 8 and 16 and insert the result (24) into the Only_On_TimeFrame value.
- Comment_Alert (default value is "--- Alert Settings ") - just a text comment describing the parameters below
- Play_Alerts (default value is "true") - set to "true" if you want the indicator plays sound notifications when an alert is triggered.
- Alert_StrikeSize (default value is "0") - the size of the value after that the sound alert will be played. If the value is "0", it determines automatically based on the current parameters.
- Alert_Numbers (default value is "3") - the number of times to play the alert if it triggered.
- Alert_Interval_sec (default value is "10") - interval (in seconds) between alert plays
- Alert_Filename (default value is "alert2") - the name of the file to play (the .wav files are located in the МТ4 \ Sounds folder, you do not need to specify the .wav extension) if alert is triggered
- Alert_Color (default value is "Tomato") - color text of alert message
- GUI (default values is "true") - flag indicating the need to draw a graphical user interface (control panel)
- GUI_Hint - using the keyboard : press "Z" to show/hide a graphical control panel
There are some examples of using the indicator:


